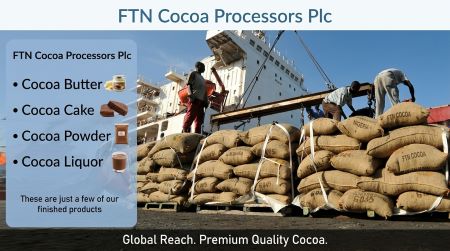
About FTN Cocoa Processors Plc
FTN Cocoa Processors Plc is a Nigerian agro-processing company listed on the Nigerian Exchange. It converts cocoa beans into semi-finished products: cocoa butter, cocoa cake, and cocoa powder.
These are the ingredients behind chocolate, confectionery, beverages, and cosmetics. It also processes palm kernel. Its business model is to buy cocoa beans, process them locally, and sell mainly to export buyers. That makes it sensitive to cocoa prices, naira movements, and its ability to fund bean purchases.
The company has had a rough few years. It posted losses after tax of ₦10.65bn in 2023 and ₦9.53bn in 2024, largely because of foreign-exchange losses and weak activity. The FY2025 audited accounts are the first real test of whether it is recovering.
Key takeaways
• Revenue: up 310% to ₦5.65bn from ₦1.38bn.
• Net loss: narrowed to ₦273.4m from ₦9.53bn.
• Gross margin: negative 12.1%, down from +61.0% in 2024. Cost of sales (₦6.33bn) exceeded revenue.
• Quality of profit: the ₦304.7m operating profit depends on a ₦1.84bn FX gain. Without it, the company would have had an operating loss of about ₦1.5bn.
• Cash flow: operations consumed ₦3.85bn, funded entirely by new borrowing.
• Balance sheet: borrowings rose 35.3% to ₦23.21bn, and equity fell 87.8% to ₦421.8m.
• Watch item: a ₦4.37bn yen bond falls due in 2026.
Headline numbers
|
Metric (₦) |
FY2025 |
FY2024 |
Change |
|
Revenue |
5.65bn |
1.38bn |
+310% |
|
Cost of sales |
6.33bn |
536.6m |
n/m |
|
Gross profit/(loss) |
(685.9m) |
839.2m |
Swing to loss |
|
Operating profit/(loss) |
304.7m |
(10.31bn) |
Swing to profit |
|
Finance costs |
578.1m |
307.2m |
+88% |
|
Loss before tax |
(273.4m) |
(10.62bn) |
Narrowed 97% |
|
Total assets |
24.14bn |
21.09bn |
+14.4% |
|
Total liabilities |
23.71bn |
17.65bn |
+34.4% |
|
Shareholders' equity |
421.8m |
3.44bn |
−87.8% |
|
Cash and equivalents |
622.2m |
76.4m |
+715% |
1. Revenue: a strong rebound, but concentrated
Revenue rose by about ₦4.27bn, signalling a real restart of processing and sales. Two products drove almost all of it:
• Export cocoa butter: ₦3.54bn (about 62.7% of revenue)
• Local cocoa powder: ₦2.10bn (about 37.2%)
Local cocoa butter sales were negligible, at ₦2.08m.
The rebound is real, but the base is narrow. Two product lines, a few key customers and one volatile input (cocoa beans) leave the company exposed to commodity prices, export demand and the naira. Because the 2024 base was so low, the 310% growth figure overstates the underlying momentum. The more useful question is whether this level of sales can be repeated and made profitable.
2. Margins: growth without profit
This is the weakest part of the results. Cost of sales jumped to ₦6.33bn, so the company spent about ₦1.12 to produce every ₦1 of sales, before any overheads.
• Raw materials: ₦5.29bn, about 84% of cost of sales
• Depreciation of plant and equipment: ₦792.2m
• Other costs (labour, repairs and maintenance, direct costs): the balance
Raw materials are the dominant cost, which suggests either high bean costs relative to selling prices or poor processing yields. Fixed costs such as depreciation and factory overheads also remain heavy relative to sales, so low capacity utilisation is another likely factor. Whatever the cause, the company is currently making more product at a loss, not a profit. Until gross margin turns positive, higher revenue will not fix the business.
3. Earnings quality: the FX gain is doing the heavy lifting
Operating profit swung to ₦304.7m from a ₦10.31bn loss. The swing came mainly from foreign exchange, with a ₦1.84bn exchange gain in 2025 against an ₦11.68bn exchange loss in 2024.
|
Operating items (₦) |
FY2025 |
FY2024 |
|
Exchange gain/(loss) |
1.84bn |
(11.68bn) |
|
Other operating income |
124.9m |
950.2m |
|
Selling and distribution expenses |
116.6m |
17.4m |
|
Operating expenses |
847.9m |
409.6m |
|
Receivables impairment |
14.1m |
n/a |
Taking out the FX gain, our estimate of operating performance is a loss of roughly ₦1.5bn. Operating profit covers finance costs only about 0.5 times, and that cover is entirely dependent on the FX gain. The company's reliance on dollar and yen-linked items means a naira move in either direction could swing earnings sharply. We would treat the ₦273.4m loss as an improvement driven by FX, not as evidence of operational profitability.
4. Balance sheet: thin equity, heavy liabilities
Total assets rose 14.4% to ₦24.14bn, but liabilities grew faster. Liabilities now equal 98.3% of total assets, leaving equity of just ₦421.8m. Borrowings stand at about 55 times equity.
Asset base:
• Property, plant and equipment: ₦15.51bn (about 64% of assets, down 4.6% on depreciation)
• Current assets: ₦7.52bn, up from ₦3.73bn
Liquidity needs a careful read. The reported current ratio of about 15.0x (7.5x in 2024) looks very strong. We would not rely on it, for three reasons:
1. Current assets include ₦1.15bn of deferred tax assets and ₦4.71bn of receivables, neither of which is cash.
2. Cash is only ₦622.2m.
3. Current liabilities of just ₦501.3m appear to exclude the ₦4.37bn yen bond maturing in 2026, which is carried within non-current borrowings. If the bond were treated as a current liability, the current ratio would fall to about 1.3x on our estimate (excluding deferred tax assets). Readers should check how the notes classify it.
Receivables: a cash-conversion problem
Trade and other receivables rose about 116% to ₦4.71bn. They consist of net trade receivables of ₦2.67bn and other receivables of ₦2.04bn, and they equal roughly 300 days of revenue.
• ₦2.01bn relates to a NEXIM Bank loan not yet received at year end.
• A further ₦1.11bn non-current export expansion grant receivable is also in the accounts. According to the notes, the related export credit certificates could not be used to settle customs duties in the last two years.
• The auditor flagged receivables recoverability as a key audit matter. An impairment allowance of ₦14.1m was booked.
These balances count as assets on paper but may take a long time to turn into cash, especially the government-linked ones.
5. Debt: ₦23.21bn and a 2026 maturity
Non-current borrowings rose 35.3% to ₦23.21bn:
|
Lender/instrument |
Amount (₦) |
|
NEXIM Bank loan |
5.00bn |
|
Corporate bond (yen, zero-coupon) |
4.37bn |
|
OH Ecosystem LLC |
7.69bn |
|
OH Origins Global Commodity Inc. |
6.15bn |
|
Total |
23.21bn |
• NEXIM facility: 9% interest, two-year tenor, secured on fixed and floating assets. It is meant to fund cocoa-bean purchases and processing for export. That should help sales, but repayment will have to come from operations.
• Yen bond: an 18-year zero-coupon bond issued in 2008 and due in 2026. The company expects to repay it partly or fully in 2026. With cash of ₦622.2m and negative operating cash flow, repayment or refinancing is the key event to watch.
• Related-party lenders: about ₦13.8bn of borrowings are owed to the two OH entities. Terms and repayment expectations matter here, and readers should look at the notes for that detail.
Finance costs of ₦578.1m look modest against ₦23.21bn of debt, an implied rate of roughly 2.5%. That reflects the zero-coupon and possibly concessional structure of some of the debt. The accrual of interest on those instruments is something to track.
6. Cash flow: funded by borrowing, not by operations
|
Cash flow (₦bn) |
2025 |
2024 |
|
Operating activities |
(3.85) |
(2.28) |
|
Investing activities* |
(0.65) |
(0.51) |
|
Financing activities |
+5.04 |
+1.99 |
|
Net change in cash |
+0.55 |
(0.80) |
|
Closing cash |
0.62 |
0.08 |
*The company's cash flow statement classifies interest paid (₦578.1m) under investing activities.
Operating cash outflow of ₦3.85bn was far larger than the ₦273.4m loss. Working capital absorbed about ₦3.13bn, mainly through a ₦2.53bn rise in receivables and a ₦708.6m rise in inventories. Capital spending was small at ₦75.3m. Financing, with additional borrowings of about ₦5.70bn, covered all of it and lifted the closing cash balance.
In plain terms, the cash balance improved because the company borrowed, not because the business generated cash. That is sustainable only while lenders keep supporting it.
7. Equity: down 88%
Equity fell from ₦3.44bn to ₦421.8m. The 2025 loss explains only a small part of that. The larger drivers were:
• ₦245.7m restatement for export sales previously overbooked
• ₦2.50bn adjustment relating to the equity component of a convertible bond
Retained earnings moved from −₦13.82bn to −₦16.84bn. Share capital is unchanged at ₦1.95bn, and the revaluation reserve of ₦14.27bn is non-cash and cannot fund debt repayment. The restatement of previously overbooked export sales is also worth noting, as it raises a question about the reliability of earlier reported revenue.
With so little equity left, even a modest loss in 2026 would put pressure on the capital structure and could prompt a recapitalisation.
Analyst's view: what to watch
|
Indicator |
Why it matters |
|
Gross margin |
Needs to turn positive. Without it, higher sales only add to losses. |
|
Operating cash flow |
Must move toward breakeven to reduce dependence on lenders. |
|
Receivables collection |
Especially the ₦2.01bn NEXIM-related balance and the ₦1.11bn export grant receivable. |
|
2026 yen bond |
Settlement or refinancing terms will test liquidity. |
|
FX movements |
Another large swing could erase or repeat this year's gain. |
|
Equity position |
A recapitalisation or sustained profits are needed to rebuild the cushion. |
Conclusion
FTN Cocoa's FY2025 results show a company that has restarted its business: sales are back, cash is higher and the headline loss is a fraction of last year's. But the underlying picture is weaker than the headlines suggest. Production costs exceed revenue, the profit improvement rests on a one-off-style FX gain, operations are consuming cash, and the balance sheet is highly leveraged with a near-term bond maturity. The turnaround case depends on margins, cash conversion and debt management over the next reporting periods.
Source: FTN Cocoa Processors Plc, Audited Financial Statements for the year ended 31 December 2025. Auditor: Baker Tilly Nigeria (unmodified opinion). Ratios and "excluding FX gain" figures are our own calculations from the reported numbers.
Disclaimer: This article analyses historical financial performance and is not a recommendation to buy or sell any security.